
End-to-end flow & observability
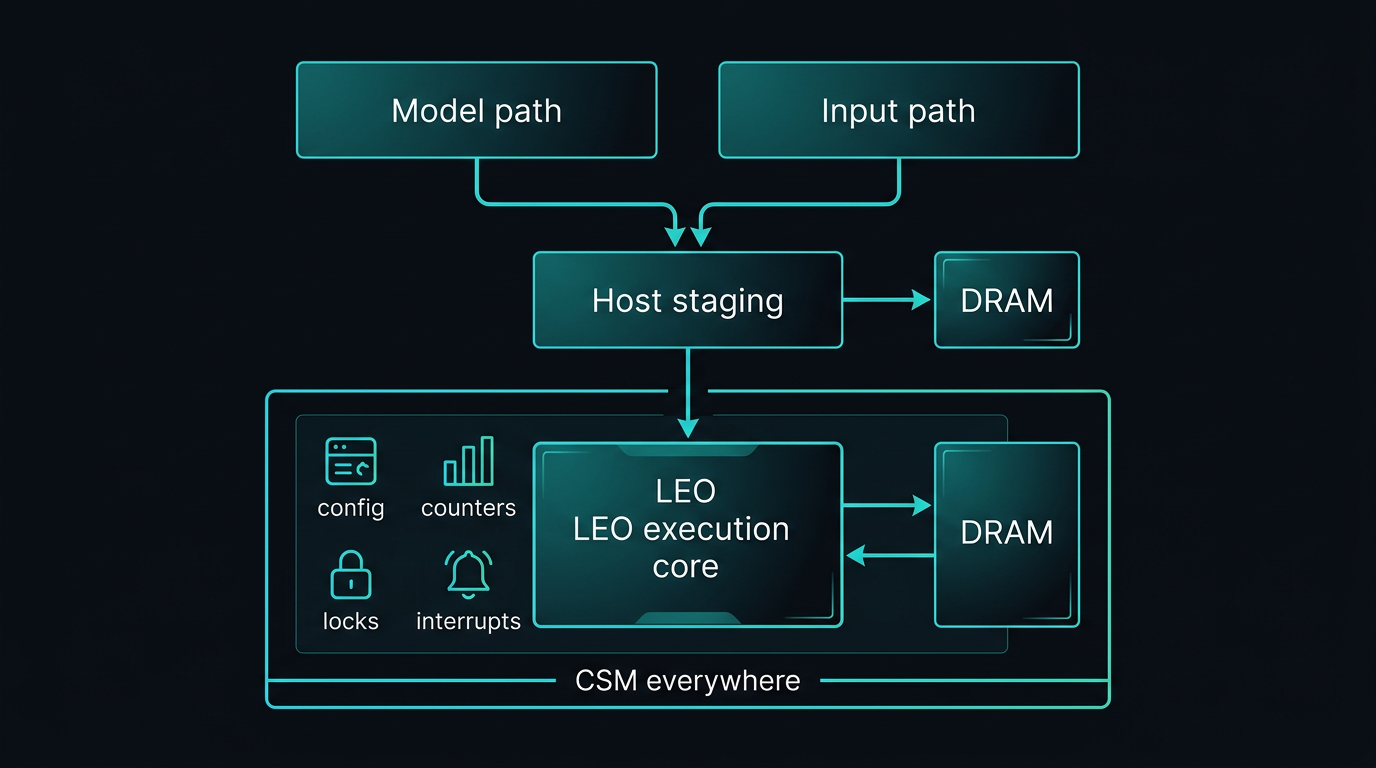
In a typical inference run, work branches before it merges on the device. The diagram in the next section shows one physical attachment pattern; the steps below spell out responsibilities in order.
- Model path — A model is selected (often from the model zoo), then the LeoGreenAI compiler lowers it and emits an instruction stream plus the model data (weights, tables, and other persistent tensors) the program needs.
- Input path — Separately, an input source (sensor, file, network, database, synthetic generator, etc.) produces the input stream (tokens, frames, features) for the run or batch.
- Host staging — The host (or runtime) uses staging DRAM for model data and the input stream as needed, and drives a direct path into the LEO execution core (e.g. instructions via PCIe and an instruction ingress path) — not only via the same buffers used for staging.
- Execution — During the run, data moves between DRAM and the core (and back) for activations, partial results, and memory-bound phases—while the core consumes instructions. Hardware-side tiling, skipping, and local reordering can change effective work from the compiler’s static plan.
- CSM everywhere — CSM spans configuration, locks, interrupts, and hardware performance counters so you can govern the engine and correlate compiler intent with measured behavior.
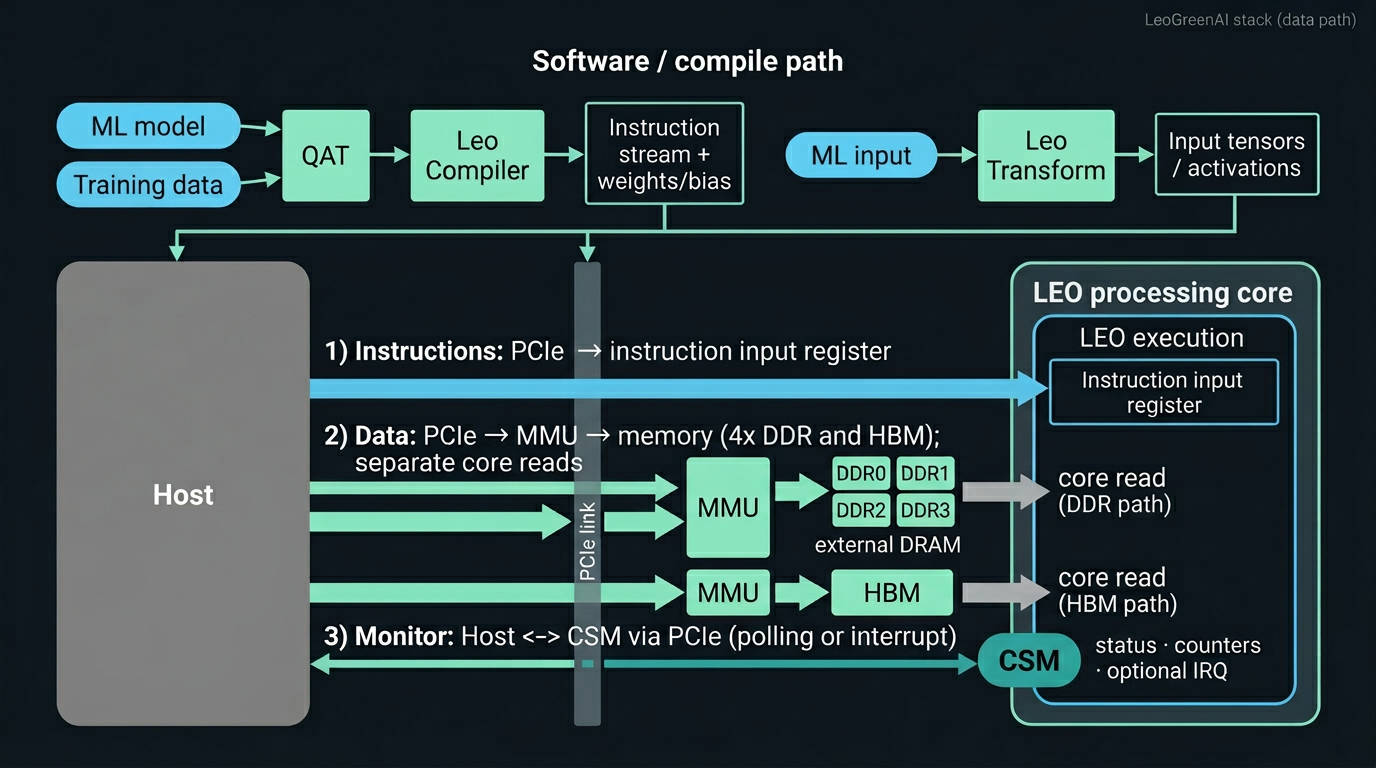
Architecture diagram — physical data-path (example)
The figure illustrates one configuration among many. Here the host attaches over PCIe; two memory channels each include an MMU between the link and memory—one serving four DDR devices, another HBM and paths into the core. Instructions follow PCIe into instruction input registers inside the LEO processing core. CSM (CSRs, counters, optional interrupts) is on the same host attachment for control and measurement alongside the data path.
Channel count, DDR organization, capacities, widths, and topology are configuration decisions, not fixed by this drawing. Tuning the memory interface remains a central lever for model–hardware co-design; see Configurability for the wider option space.
Missing docs/images/leogreenai-stack-diagram-dual-mmu-v4.png. Save the exact PNG you approved in chat, then from docs run
powershell -ExecutionPolicy Bypass -File fix-stack-image.ps1 -Source "C:\path\to\your-saved.png"
(do not rely on regenerated files under .cursor\assets).
Compiler: the plan
- Lowering & IR — ONNX-compatible flow with LeoGreenAI quantization-aware and IR-reduction options.
- Instruction mapping — CISC-style ISA coverage for conv, attention, and supporting transforms.
- Breaking & software tiling — how large ops are split for the ISA, how tiles and waves are chosen, and how parallel instruction streams are laid out where dependencies and memory footprints permit.
- Visualization — tooling to inspect the computational graph and mapping choices (where enabled in your build).
The compiler’s tiling and schedule are not the entire tiling story. The LEO execution core also applies its own hardware-side tiling and sub-blocking as it maps logical tiles to arrays, buffers, and memory bursts. The full picture is a cooperative split: software proposes shape and ordering; hardware refines what actually runs on the floorplan. Interpreting performance therefore benefits from both compiler-side plans and on-chip behavior.
Hardware execution: beyond the compiled schedule
The core is not a passive interpreter of a fixed micro-schedule. It can exploit structure in the data and in the instruction window to go faster than a literal “programmed” step count would suggest.
- Zero skipping — hardware detects or exploits sparsity and zero-valued regions so work that would not change results is not done at full cost.
- Boundary skipping (convolution) — at image or tile edges, partial or empty convolution windows can be short-circuited instead of executed as dense inner loops, yielding speedups beyond what is explicitly encoded in the instruction stream.
- In-window reordering — within an instruction window, the machine may seek out-of-order execution opportunities and reorder when dependencies and resources allow. The compiler can constrain that freedom (e.g. fences or dependency annotations) for determinism or debugging, or grant slack so hardware can improve throughput.
Because of these effects, end-to-end analysis needs both views: compiler-side tiling, stream layout, and constraints, plus CSM-backed counters and traces (stalls, skips, reorder events, utilization).
CSM: hardware statistics & control
The CSM (control and statistics module) is the read/write path between the host and the accelerator: configuration status, shared-resource locks, interrupts, debug handshakes, and hardware performance counters. Because the LEO execution core architecture is designed for extension, additional on-chip signals can be brought out as custom counter banks when a program needs deeper visibility.
- Parallelism & time — end-to-end model runs, per-region timings, overlap between instruction streams.
- Parallelism accounting — compare total runtime to aggregated per-operation activity to see how much concurrency the workload actually exploited on this configuration.
- Utilization — activity and stall attribution across major blocks (compute, memory paths, specialized IPs).
- Structural effects — visibility into when shared resources force serialization even when the compiler scheduled for overlap.
- Provenance — configuration and build identity surfaced through CSRs so captures are reproducible.
Why both layers matter
When comparing architectures or compiler variants under accuracy constraints, outcomes depend on how much parallelism actually materializes and how evenly resources are used. Software chooses graph-level tiling and stream layout; the core may refine tiles, skip work, or reorder locally. CSM together with compiler-side reports reconciles those two stories—linking planned structure to stalls, utilization, skip activity, and reorder slack in ways neither view alone can approximate reliably.